
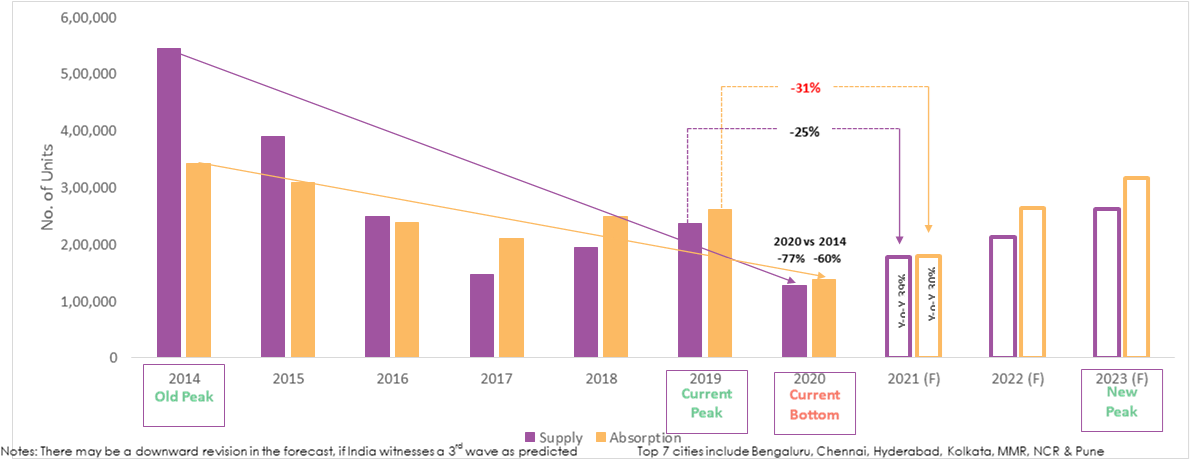
- 2019 attained a new peak since 2017 with more than 2.6 lakh units sold in the top 7 cities & 2.37 lakh new units launched; new peak likely by 2023 as housing sales could cross 3.17 lakh units mark
- 2021 may fare better than 2020, but unlikely to reach the latest peak levels of 2019
- MMR & Bengaluru to drive top 7 cities’ residential activity in 2023
- In 2021, housing sales in the top 7 cities are expected to rise by 30% against 2020, new launches may rise by 35%
- Sales-to-supply ratio increased to 1.25 b/w 2017-2019 from 0.75 in 2014-2016; estimated to be nearly 1.21 in 2023
Mumbai 19 August 2021: The unprecedented rise in homeownership sentiment, faster adoption of technology and digital marketing, and innovative business practices have served to soften the overall impact of COVID-19 on the Indian residential sector. In fact, the housing market in top 7 cities is likely to attain a new peak by 2023, when housing sales are estimated to cross 3.17 lakh units and new launches by 2.62 lakh units during the year.
City-wise, MMR and Bengaluru are all set to lead from the front with maximum housing sales and new launches in 2023. Of the total estimated housing sales and new launches in 2023:
- MMR is likely to comprise a 28% share of total sales and nearly 30% of new launches
- Bengaluru is estimated to have a 20% share of homes sold and a 17% share of units launched
- NCR may comprise an 18% share of sales and 15% of new launches
- Pune will retain its strength among the most active markets and may corner a 15% sales share and 18% new launches share
- Kolkata, Chennai and Hyderabad may each account for approx. 6% of sales and 8% of new launches
(Calculations based on y-o-y and q-o-q absorption and launch data trends in the respective cities & ongoing trends)
2021 is expected to fare better than 2020, but it is unlikely to reach the levels of 2019 – the most recent peak year.
Anuj Puri, Chairman – ANAROCK Property Consultants says, “The residential sector was showing healthy year-on-year growth since 2017 until the latest peak year of 2019, but this trajectory was derailed by the COVID-19 pandemic. Otherwise, 2020 was expected to be a watershed year for the housing sector. While the second half of the year did showcase the remarkable resilience of Indian residential real estate, a new bottom for the sector was created in 2020 with housing sales plunging to nearly 1.38 lakh units while new launches dropped to 1.28 lakh units. 2020 is not a year that the industry is likely to forget very soon.”
Encouragingly, the ongoing trend of sales exceeding supply is likely to continue and 2021 is expected to witness an increase of 35% in housing launches and a 30% increase in sales over the previous year. However, against the peak year of 2019, supply and sales may be lower by 28% and 31% respectively.
“The trend of demand remaining buoyant can be attributed to several factors,” says Anuj Puri. “These include but are not limited to sustained low interest rates, an overall improvement on the job market, resumed economic activity and sustained stock market growth, various government interventions to combat the pandemic’s deleterious effects, and an increasing desire to own physical assets during times of unprecedented uncertainty.”
With the vaccination drive gaining significant momentum and the spread of COVID-19 under better control for now, 2023 will very likely emerge as the new peak year that breaches 2019 levels with supply that year growing by 11% and sales by 22% over 2019.”
A new peak in 2023 notwithstanding, we are unlikely to see the levels of supply and sales witnessed in 2014 anytime soon.
Key Changes: 2014-2016 Vs 2017-2019
Amid rapid transformation in the sector, two key changes are visible:
- Supply rationalization: Developers decided to throttle back supply to keep demand buoyant
|
Time period |
2014-2016 |
2017-2019 |
|
Supply (Units) |
1,185,000 |
5,78,700 |
|
% change |
NA |
-51% |
Source: ANAROCK Research (Data for the housing market in top 7 cities only)
- Sales exceed supply: With end-users the primary sales drivers amid controlled supply, sales began exceeding the supply. This trend is likely to continue in the future as well.
|
Period |
2014-2016 |
2017-2019 |
|
Supply (Units) |
1,185,000 |
578,700 |
|
Sales (Units) |
890,500 |
720,800 |
|
Sales/Supply Ratio |
0.75 |
1.25 |
Source: ANAROCK Research (Data for the housing market top 7 cities only)
2 Comments