
Despite India’s 8.7% GDP growth in FY22, this was only in comparison to a nearly 6.6% GDP contraction in FY21, implying that the Indian economy is still limping back to health with much of the gains realized during pre-pandemic times. This study looks at how sectors fared during those two years and how capacity utilization is merely an indicator of progress rather than production or net sales, which are subject to base effects.
What is Capacity Utilization and its alternative?
When it comes to economic growth, capacity utilization is one of the most important indicators. Capacity utilization is defined as the percentage of what a company can produce relative to its installed capacity. This means that the higher this ratio gets, the more likely an investor would want to invest in capital because a company can generate more output with future investment. However, getting this data from a company or company’s annual reports used to be easy. That has changed now however and companies no longer have to disclose it on their annual reports.
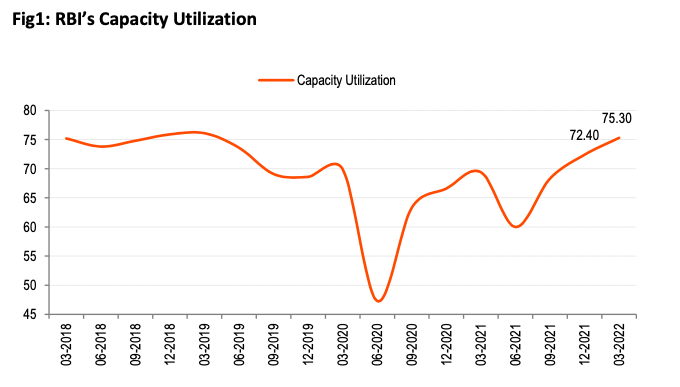
The only source of information we have about how the economy of India is doing comes from a quarterly survey conducted by the Reserve Bank of India. The OBICUS Survey, conducted in Q4, was particularly telling as capacity utilization went up significantly to 75.3 percent in Q4 from 72.4 percent in Q3. Capacity utilization has remained high – with a few exceptions – and is expected to keep on increasing since it is closely linked to demand levels in the economy.
Why is asset turnover ratio important?
However, expanding our analysis of the fixed assets turnover ratio to look at trends in 2019 and 2022, this study investigates its levels across over 1365 uniformly selected firms with an aggregate industry size of 405 million. The sector’s 45 manufacturing industries have been excluded from this exercise. To maintain parity in terms of sectors relevant for capacity utilization, banks, insurance firms, and rating firms have been excluded from the sample.
India has been recovering from the recession with some of the high frequency indicator metrics signaling a return to a healthier condition. Focusing on manufacturing, indicators such as industrial production and core sector growth have also shown robust demand. But are all industries really out of the woods yet, or do some sectors need special attention? In comparing FY22 fixed asset turnover ratio to FY21’s numbers, it had seemed that even excluding two sectors i.e Photography and Education and Training, all other sectors registered much higher ratios under FY22 than in previous years. However, after further analyzing these numbers over time to compare with the pre-pandemic period in fiscal years 2019 and 2022, there is a different story emerging.
Which sectors have the best asset turnover ratios in India?
| Sectors | FY19 | FY22 |
| Telecom | 0.2 | 0.21 |
| Non-Ferrous Metals | 0.64 | 0.82 |
| Ship Building | 0.69 | 1.01 |
| Construction Materials | 0.84 | 0.86 |
| Iron & Steel | 1.07 | 1.19 |
| Ferro Maganese | 1.18 | 1.59 |
| Gas Transmission | 1.2 | 1.55 |
| Textile | 1.29 | 1.48 |
| Plastic Products | 1.67 | 1.88 |
| Chemicals | 2.35 | 2.39 |
| Mining | 2.99 | 3.98 |
| Electricals | 3.17 | 3.22 |
| Trading | 18.25 | 22.96 |
| Power | 0.39 | 0.35 |
| Logistics | 0.87 | 0.75 |
| Hospitality | 0.99 | 0.65 |
| Paper | 1.04 | 0.88 |
| Media & Entertainment | 1.29 | 0.64 |
| Diversified | 1.39 | 1.2 |
| Healthcare | 1.52 | 1.37 |
| Inds. Gases & Fuels | 2.03 | 1.79 |
| Crude Oil | 2.05 | 1.84 |
| Agriculture | 2.09 | 1.95 |
| Photographic Products | 2.19 | 0.37 |
| Miscellaneous | 2.36 | 2.23 |
| Alcohol | 2.44 | 2 |
| Automobile & Ancillaries | 2.51 | 2.01 |
| Aviation | 2.58 | 1.07 |
| Abrasives | 2.75 | 2.59 |
| Education & Training | 3.15 | 1.38 |
| Realty | 3.26 | 2.92 |
| FMCG | 3.27 | 1.99 |
| Capital Goods | 3.31 | 2.7 |
| IT | 3.8 | 3.34 |
| Retailing | 3.9 | 1.74 |
| Infrastructure | 6.29 | 5.43 |
| Consumer Durables | 6.63 | 5.04 |
| Diamonds & Jewellery | 13.54 | 9.16 |
According to a report by Bank of Baroda Research, Out of 40 sectors, only fifteen saw some improvement in their asset turnover ratios for fiscal year 2022, compared to fiscal year 2019. In the Indian economy, it is yet to be said that India is back on track.
Indian Economy – the final verdicts
The turnover to gross fixed assets ratio, which is a proxy for capacity utilization in the corporate sector shows a mixed bag of higher and lower numbers when compared with FY19. This ratio, free of base effects, provides further hints on the level of activity in the corporate sector as it is less able to hide economic hurdles. FY20 showed a depressed performance in terms of profitability caused by the lockdown that was imposed on March 31st. The turnover to gross fixed assets ratio was partially offset by the pandemic lockout which had an effect on production throughout FY21. Though both past and current values are affected by lockdowns, in this analysis the increase or decrease is based on when the lockdowns were lifted: from the pre-pandemic year in FY19 to the pandemic year in FY22.
A recovery of Indian economy in this ratio for 13 sectors indicates that the recession has been real. The metals group, some intermediates like chemicals and textiles as well as services have shown an increase in the ratio. For 25 sectors, though, the picture is still a concern as the ratio of turnover to GFA is still lower than pre-pandemic times. These sectors are more in the service segment other than goods with a capital goods sector.
See Also: Are trade and economic sanctions against Russia risky?
7 Comments